ClickUp has quickly established itself as one of the most versatile work management platforms in the market. Its intuitive interface, powerful features, and ambitious “one app to replace them all” tagline make it highly attractive for teams of all sizes. Whether you are a creative agency, a tech startup, or an enterprise PMO, ClickUp promises to streamline task management, goal tracking, documentation, collaboration, and reporting, all in one place.
But with great flexibility comes great temptation.
At Dtech Systems, we’ve helped dozens of organizations implement and optimize ClickUp. One of the most common challenges we encounter is clients trying to stretch ClickUp into use cases it wasn’t built to handle, most notably, using it as a replacement for Excel-style modeling or full-blown project management suites (PM suites) like Microsoft Project, Planview, or Primavera.
This article explores:
- The most common overuses of ClickUp
- Why these limitations exist
- Real-world examples from our consulting work
- What we’ve done to help clients stay efficient
- Tools and strategies to complement ClickUp properly
- How to know when to pivot to something else
Where Overuse Commonly Occurs
a. Pivot Table Reporting and Data Aggregation
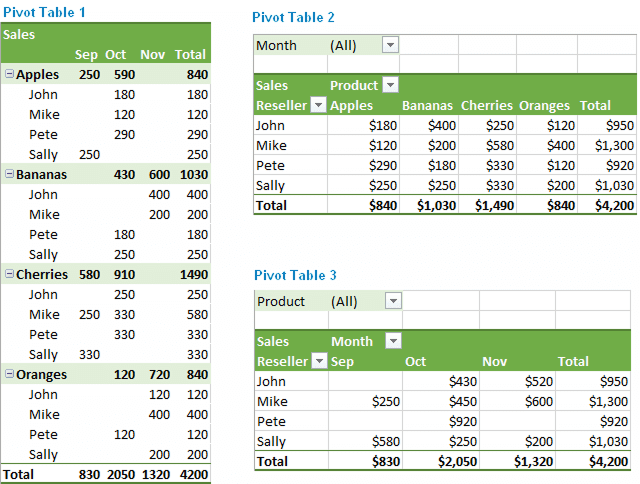
Clients often come in expecting ClickUp to behave like Excel, Google Sheets, or Power BI, especially when it comes to complex reporting. They want to:
- Group tasks by multiple custom fields
- Aggregate numerical data (totals, averages, percentages)
- Use slicers, filters, and interactive views
- Generate multi-layered reports dynamically
- Export and drill into datasets with dependencies
While ClickUp’s dashboard widgets offer simple visualizations like bar charts, pie charts, and task tables, they lack the granularity and configurability needed for advanced pivoting.
This becomes a real issue when:
- A marketing team wants to analyze campaign results by region, channel, and quarter.
- A PMO wants to roll up costs per department, per phase, and across projects.
- An engineering team wants to slice sprint progress by developer and priority.
ClickUp’s built-in dashboards simply are not designed for these types of calculations and dynamic data transformations.
b. Deep Financial Modeling or Cost Forecasting
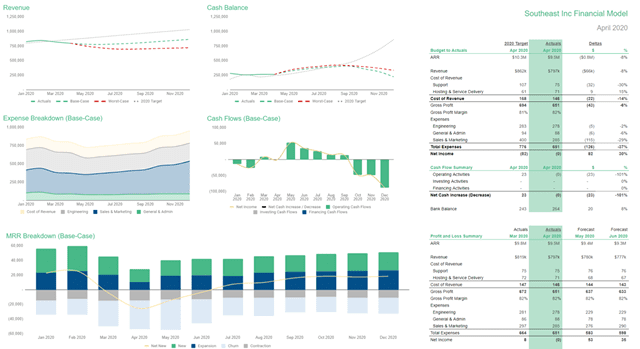
We’ve seen many clients attempt to build entire cost models inside ClickUp. These include:
- Effort vs. rate cost projections
- Burn-up and burn-down modeling
- Vendor rate tables linked to deliverables
The limitations here are due to ClickUp’s lack of:
- Currency formatting and conversions
- Time-based trend visualizations over rolling periods
Unlike Excel or financial modeling tools, ClickUp doesn’t support chained logic, conditional formatting, goal-seeking, or real-time recalculations across large datasets.
c. Offline Planning and Local Workflows
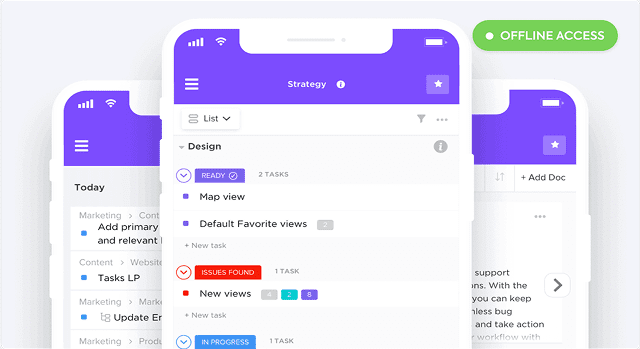
While ClickUp does offer limited offline support via its mobile app, it’s not practical for:
- Field teams needing full offline access on laptops
- Countries or environments with unreliable internet
- Remote simulation or data entry during travel
Users expecting an offline-first experience, like Excel or Notion offline mode, will be frustrated. Tasks cannot sync while offline, nor can forms, dashboards, or automation run.
Why These Limitations Exist
ClickUp’s core design is centered on real-time collaboration, flexible task tracking, and visual management, not data modeling or enterprise resource simulation.
It is not designed to replace:
- Excel (for modeling)
- Power BI (for analytics)
- Smartsheet (for sheet-based logic)
ClickUp prioritizes flexibility, speed, and usability. The trade-off is depth in niche functionalities like chained formulas, multi-variable dependencies, or modeling scenarios.
What We’ve Done to Bridge the Gap
a. Redirect to External Tools Where Appropriate
We often pair ClickUp with:
- Google Sheets for financial calculations
- Airtable for data structuring with relational views
- Power BI / Looker Studio for enterprise dashboards
- Jotform or Typeform for smarter form logic
- Zapier / Make.com for automated data movement
This allows clients to preserve their desired reporting and modeling depth, while still using ClickUp as the action and collaboration hub.
b. Set Expectations Early
We’ve learned to clarify boundaries early in every ClickUp onboarding:
- “This is not a spreadsheet tool.”
- “You cannot do rollup summaries the same way Excel can.”
- “Let’s plan the modeling and reporting in a connected tool instead.”
Managing expectations avoids time wasted trying to overbuild within ClickUp.
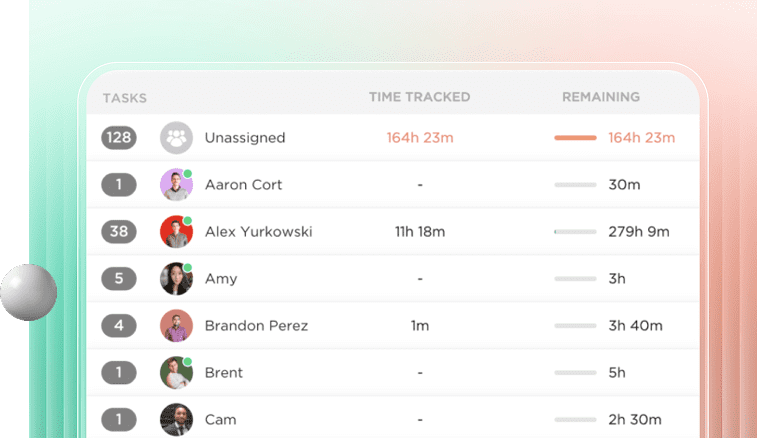
c. Use Templates and Dashboards for Execution Visibility
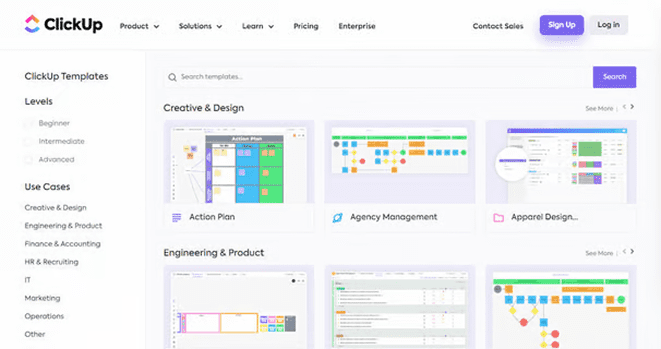
While deep modeling isn’t feasible, we still help clients:
- Create execution dashboards by project, team, or region
- Use goals, workload views, and status-based reports
- Apply task templates with baseline scoring and tracking fields
This ensures teams still get a performance overview and execution clarity without pretending ClickUp can do what Excel or Smartsheet can.
Tips for Clients Still Trying to Model Inside ClickUp
If you absolutely must work within ClickUp for light modeling, here’s how to get the best results:
- Use only numeric and dropdown fields for structured inputs.
- Avoid chaining formulas keep logic in a single field where possible.
- Use List-level dashboards for context-specific insights.
- Use Relationships + Rollups to bring in relevant data (though it is read-only).
- Create a “Data View” List where you standardize your calculations or central inputs.
- Sync data out regularly for external reporting don’t rely on ClickUp for final output.
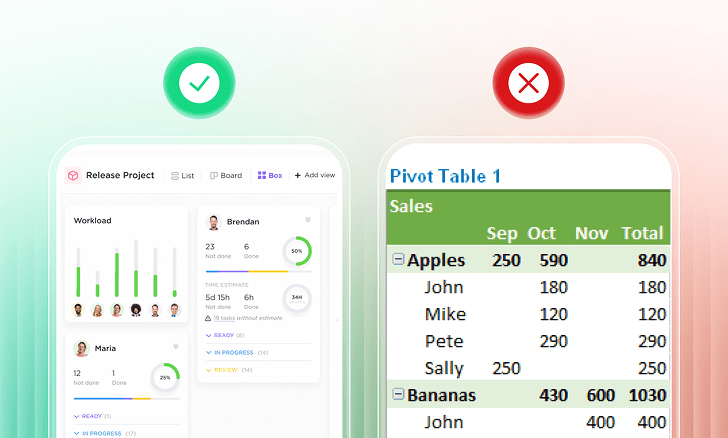
When to Use ClickUp, When to Use Something Else
✅ Use ClickUp for:
- Task and workflow management
- Sprints, campaigns, deliverables, approvals
- Goal tracking and execution monitoring
- Cross-functional collaboration and documentation
❌ Don’t use ClickUp (alone) for:
- Budget modeling
- Scenario planning
- Deep formula-based reporting
- Pivot-table performance reviews
- Offline-first planning
Instead, pair ClickUp with:
- Google Sheets or Excel for modeling
- Power BI or Tableau for reporting
- Airtable for data structuring
- API automations for data flow
Final Thoughts: ClickUp Is Brilliant – But Not a Spreadsheet or Simulator
ClickUp’s flexibility is a gift. But with that flexibility comes the danger of overreach. When teams try to use ClickUp as a substitute for Excel, Power BI, or PM suites, the platform starts to break down not because it is flawed, but because it is being asked to do something it was never meant to do.
At Dtech Systems, we’ve made it our mission to help teams use ClickUp for what it does best and supplement it with the right tools where needed. By clarifying expectations, integrating smartly, and modeling externally, we’ve helped dozens of organizations reclaim hours of wasted time, reduce reporting errors, and build scalable execution systems.
Need Help Optimizing Your ClickUp Setup?
We are ClickUp’s only verified partner in Saudi Arabia, and we help teams across the world get the most out of ClickUp.
Whether you need:
- A scalable ClickUp structure
- Integrations with Excel, Sheets, BI, or Airtable
- Custom dashboards and reporting workflows
- SOPs and training for task governance
📞 Book a free consultation with Dtech Systems today.
Let’s stop over engineering ClickUp and start making it work the way it was meant to.