How Real-Time Dashboards Help Businesses Make Better Decisions

Businesses generate large amounts of information every day. From sales figures and project updates to customer activity and operational performance, there is no shortage of data. The real challenge is knowing what that information means and how to use it to make better decisions.
Many organisations still depend on spreadsheets, manually prepared reports, and information collected from different departments. By the time these reports reach decision-makers, the situation may have already changed. A delayed update can make it harder to identify problems, respond to new opportunities, or understand how the business is performing.
This is where real-time dashboards become valuable.
Real-time dashboards bring important business information together in one place, giving teams and decision-makers a clearer view of what is happening across the organisation. Instead of waiting for the next report, they can monitor key performance indicators (KPIs), identify changes, and respond based on more current information.
What Are Real-Time Dashboards?
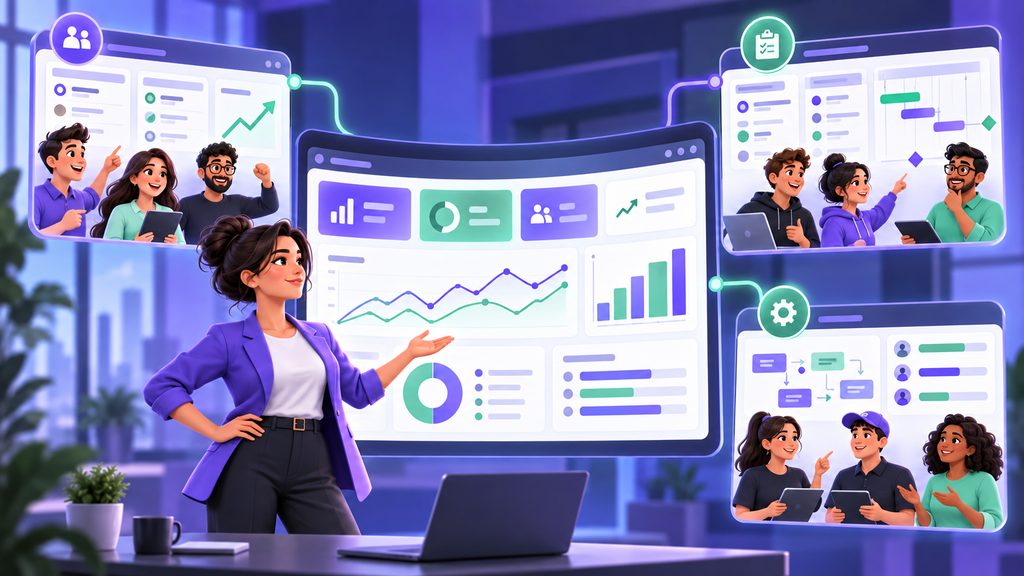
A real-time dashboard is a visual tool that brings data from different sources into a central view and updates it as new information becomes available.
Instead of reviewing multiple spreadsheets, reports, or software platforms, users can access important business metrics through charts, graphs, tables, and performance indicators.
For example, a business dashboard might display:
- Sales performance and revenue targets.
- Ongoing projects and their completion status.
- Team workloads and task progress.
- Customer activity and satisfaction metrics.
- Operational costs and resource utilisation.
- Marketing campaign performance.
The information is presented in a way that makes it easier to understand current performance and identify areas that need attention.
It is important to understand that real-time does not always mean information updates every second. Some business activities require immediate updates, while others work perfectly well with hourly or daily refreshes. The appropriate update frequency depends on how quickly the information needs to support a decision.
6 Ways Real-Time Dashboards Help Businesses Make Better Decisions
1. Provide a Clear View of Business Performance
One of the biggest challenges for business leaders is understanding what is happening across different departments.
Sales teams may track revenue in one system, project managers may monitor deliverables in another, and operations teams may maintain separate reports. Bringing this information together can be difficult, particularly when each department uses different reporting methods.
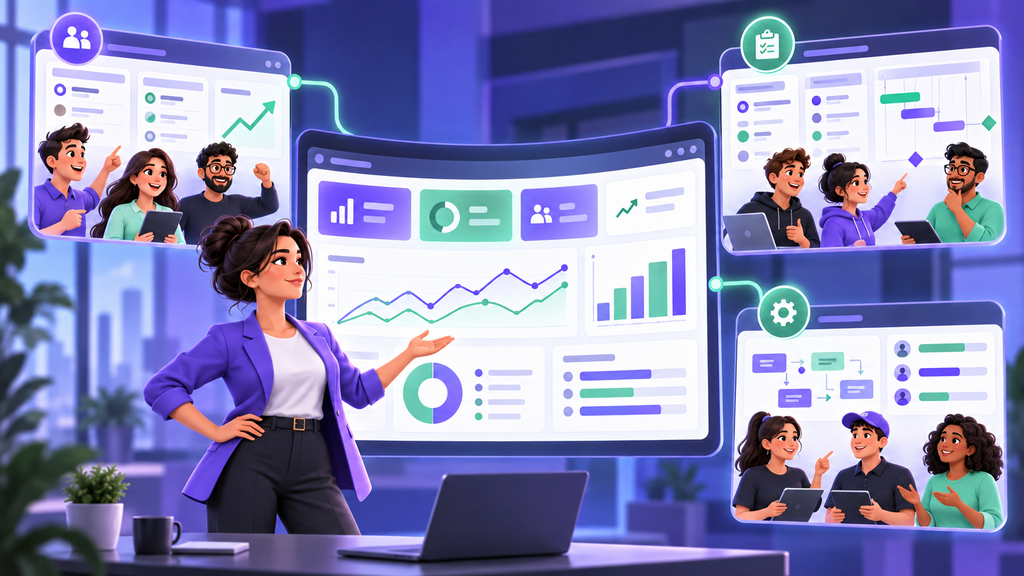
Real-time dashboards provide a central view of important business metrics. Decision-makers can monitor performance across departments without waiting for separate updates.
For example, a business leader can review sales performance, project progress, and operational activity from one dashboard. This makes it easier to understand how different areas of the organisation are performing and where additional attention may be required.
2. Help Identify Problems Before They Become Bigger
Business problems are not always immediately visible. A delayed project, declining sales performance, increasing operational costs, or an overloaded team can develop gradually.
When information is only reviewed during weekly or monthly meetings, these issues may go unnoticed for longer than necessary.
Dashboards help organisations monitor performance indicators and identify unusual changes.
For example, if a project begins falling behind schedule, a dashboard can highlight overdue tasks, upcoming deadlines, and changes in completion progress. Managers can investigate the situation and address potential delays before they affect other deliverables.
The earlier a problem becomes visible, the more time a business has to respond.

3. Reduce Dependence on Manual Reporting
Preparing business reports manually can take considerable time. Employees often need to collect information from different platforms, update spreadsheets, verify figures, and prepare summaries for management.
This creates additional work and increases the possibility of outdated information or reporting errors.
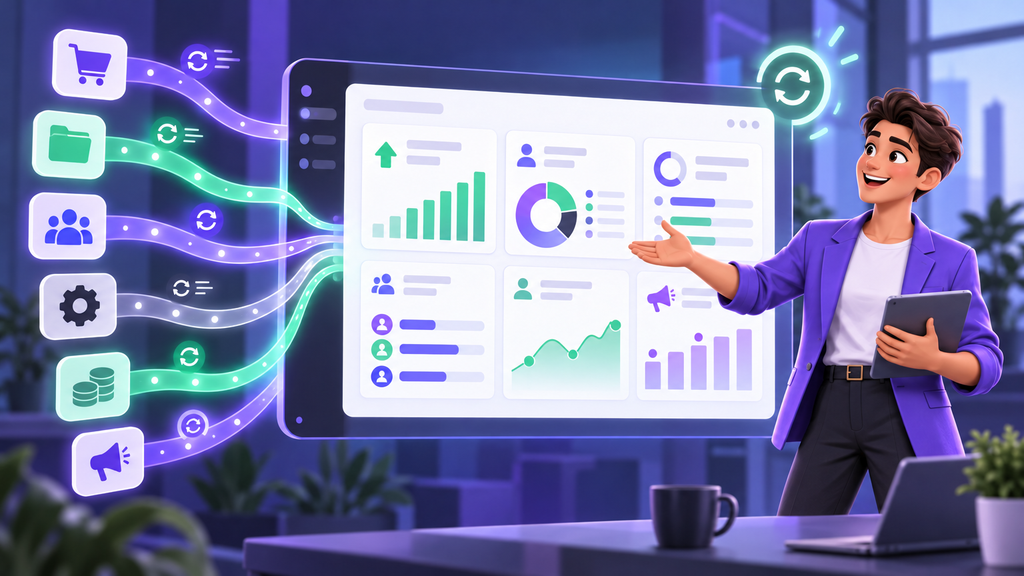
With connected dashboards, much of this reporting process can be streamlined. Data can be collected from integrated systems and displayed in a consistent format, reducing the need to repeatedly compile information manually.
Teams can spend less time preparing reports and more time understanding what the information reveals.

4. Improve Team Accountability and Collaboration
Effective decision-making depends on more than management having access to information. Teams also need to understand their responsibilities, priorities, and progress.
Dashboards make it easier to monitor work across departments by providing visibility into assigned tasks, deadlines, project milestones, and performance indicators.
For example, a project manager can identify which activities are progressing as planned, which tasks are overdue, and where workloads may need to be redistributed.
When everyone works with a shared view of progress, conversations become more focused. Teams can discuss actual performance, identify obstacles, and agree on the next steps.
This also helps managers understand where support or additional resources may be needed.

5. Support Faster and More Informed Decisions
Waiting for information can slow down important business decisions.
Consider a marketing team monitoring several campaigns. If campaign performance is only reviewed at the end of the month, the team may miss opportunities to adjust spending or improve underperforming activities.
A dashboard displaying current campaign performance allows managers to review relevant metrics, compare results, and make adjustments when necessary.
The same principle applies to sales, finance, project management, and operations.
By making relevant information easier to access, dashboards help decision-makers spend less time searching for answers and more time evaluating their options.

6. Help Businesses Recognise Trends and Opportunities
Dashboards are not only useful for monitoring what is happening now. They can also help businesses understand how performance changes over time.
Comparing current figures with historical data can reveal patterns that might otherwise be difficult to notice.
For example:
- Sales dashboards can highlight changes in revenue across different periods.
- Marketing dashboards can show which campaigns generate stronger engagement.
- Project dashboards can reveal recurring delays or resource bottlenecks.
- Financial dashboards can help identify spending patterns and budget variations.
These insights help organisations understand where improvements are needed and where new opportunities may exist.

What Should a Business Dashboard Include?
A useful dashboard should provide information that supports specific business objectives. Including too many metrics can make it difficult for users to identify what actually matters.
The right information depends on the department, role, and decisions the dashboard is intended to support.
Here are some examples:
| Dashboard type | Important metrics |
| Executive dashboard | Overall business performance, strategic goals, revenue and departmental progress |
| Sales dashboard | Revenue, conversion rates, sales pipeline and targets |
| Project management dashboard | Task completion, deadlines, milestones and project status |
| Marketing dashboard | Campaign performance, engagement, leads and conversions |
| Financial dashboard | Expenses, budgets, cash flow and financial performance |
| Operations dashboard | Productivity, resource utilisation, operational efficiency and service levels |
The objective is to give each team access to the information it needs without overwhelming users with unnecessary data.
Common Mistakes Businesses Should Avoid
Implementing a dashboard does not automatically improve decision-making. Its effectiveness depends on the quality of the information and how people use it.
Some common mistakes include:
Tracking too many metrics: More information does not always mean better visibility. Focus on the indicators that directly support business objectives.
Using outdated or inconsistent data: If different departments use conflicting figures, the dashboard may create confusion instead of clarity. Establish consistent definitions and reliable data sources.
Ignoring data integration: Information spread across disconnected platforms makes it difficult to maintain a complete picture of business performance.
Failing to define responsibilities: Teams should know who monitors specific metrics and who is responsible for responding when performance changes.
Focusing on appearance rather than usefulness: An attractive dashboard is not necessarily an effective one. Its design should make important information easy to understand and act upon.

How to Get Started with Real-Time Dashboards
Businesses do not need to transform their entire reporting structure at once. A practical approach is to start with the information that has the greatest impact on everyday decisions.
Here are a few steps to consider:
- Identify your business objectives: Determine which decisions need better or more timely information.
- Choose relevant KPIs: Select measurable indicators that reflect your business goals.
- Identify your data sources: Understand where the required information currently exists and whether different systems can be connected.
- Build dashboards around users: Give managers, department heads, and teams views that match their responsibilities.
- Establish data ownership: Make sure information is accurate, consistently defined, and regularly updated.
- Review and improve: Evaluate whether the dashboards are helping people make better decisions and adjust them as business needs change.
Starting with a few well-designed dashboards can help organisations build confidence in data-driven decision-making before expanding across other departments.

Turn Business Data into Better Decisions with Dtech
Having access to business data is only the beginning. The real value comes from making that information useful to the people responsible for planning, managing, and delivering work.
At Dtech, we help organisations improve the way they manage work, connect processes, and use technology to support better business outcomes. Through strategic consulting, work management solutions, and technology implementation, we help businesses create more structured and informed ways of working.
Whether your organisation wants better project visibility, clearer performance reporting, or more connected workflows, the right technology and processes can make a meaningful difference.
Explore smarter ways of working with Dtech:https://dtechsystems.co