Real-Time Dashboards: 5 Ways They Drive Better Decisions

It’s Monday morning. The leadership meeting starts in ten minutes, and someone is still updating the status spreadsheet. By the time the numbers reach the screen, they are already a week old.
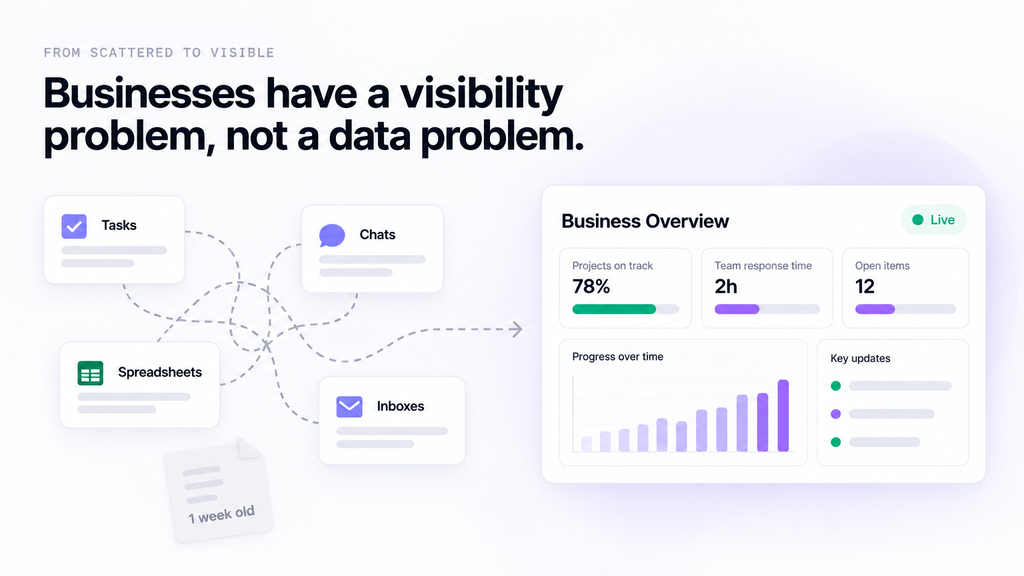
Most businesses don’t have a data problem. They have a visibility problem. The information exists, but it’s spread across tasks, chats, spreadsheets and inboxes. Real-time dashboards fix that by putting the numbers that matter on one screen that stays current.
Here’s how they help teams make better decisions, what to track first and why some dashboards never get used.
What Is a Real-Time Dashboard?
A real-time dashboard is a visual screen that pulls data directly from the systems where work happens. Nobody exports, copies or formats anything. When a task moves, a deadline passes or an approval lands, the dashboard reflects it.
In ClickUp, dashboards are built from cards: charts, task lists, workload views, time tracking and AI summaries. Each card reads live task data from your Spaces, Folders and Lists. Dashboards refresh automatically, and any card can be refreshed on demand. So instead of asking “where are we on this?”, a manager just opens the dashboard.

Static Reports vs Real-Time Dashboards
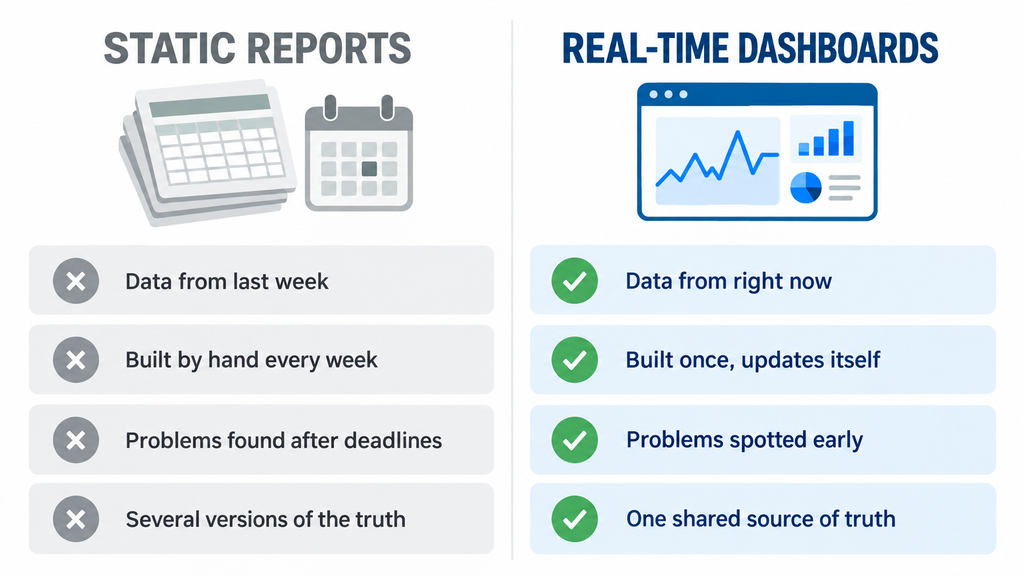
| Static reports | Real-time dashboards | |
| Data freshness | As of the last export | Current, straight from the work |
| Effort | Rebuilt by hand every week | Built once, updates itself |
| Problems | Found after the deadline | Spotted while there’s time to act |
| Question answered | What happened? | What’s happening, and what needs attention? |
| Trust | Depends on who built it | One shared source of truth |
Static reports still have a place for monthly reviews and board packs. But for day-to-day decisions, a week-old number is a guess.
5 Ways Real-Time Dashboards Help Businesses Make Better Decisions
1. Problems show up before deadlines are missed
Overdue tasks, stuck approvals and slipping milestones appear the moment they happen, not at the end-of-month review.
Picture a purchase request waiting on a manager’s approval. In a weekly report, nobody notices until it’s six days late. On a live dashboard, it shows up on day two, while there’s still time to chase it. That’s the difference between reacting and preventing.

2. Meetings move from updates to decisions
When everyone can see progress before the meeting, nobody needs to spend 30 minutes reading out status updates. The meeting starts with the dashboard on screen and goes straight to the real questions: what’s blocked, what needs a decision and who owns it.
Many teams find they can shorten, or even cancel, recurring status meetings once the dashboard becomes the place everyone checks first.
3. Workload gets balanced before burnout hits
Workload cards show how much each person has on their plate this week. If one designer has 14 tasks due and another has three, a team lead can rebalance the work in minutes. In ClickUp’s Workload view, each person’s capacity shows in red, yellow or green, so it’s obvious who is over capacity and who has room for more.
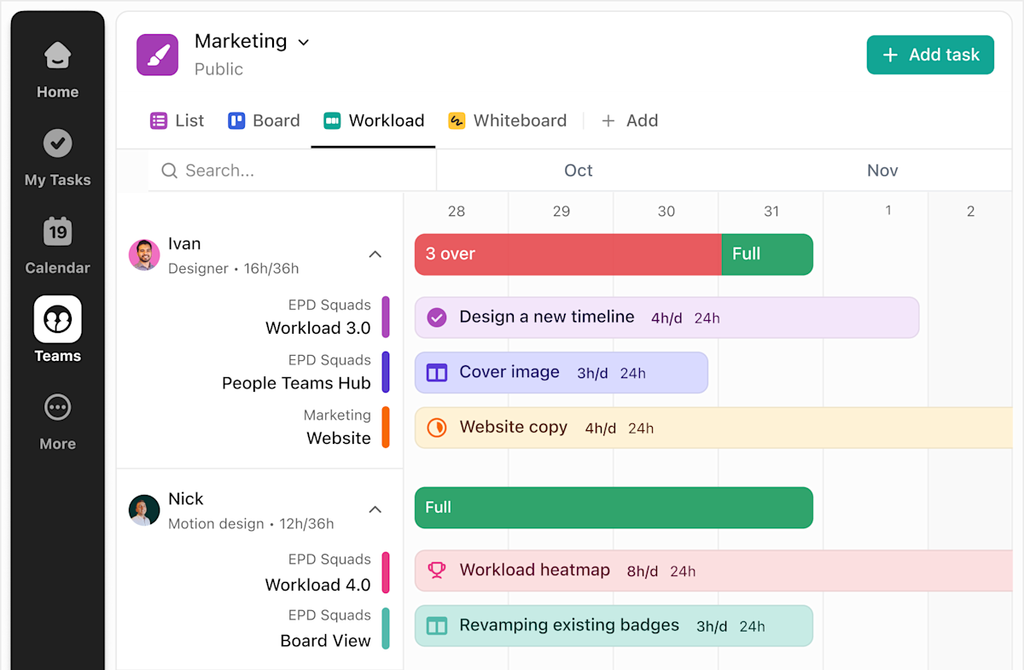
Without that view, the first sign of overload is usually a missed deadline or a frustrated employee.
4. Everyone works from one version of the truth
When finance, operations and project teams each keep their own spreadsheet, every meeting becomes a debate about whose number is right. A shared dashboard ends that, because everyone is looking at the same live data.
One catch: a dashboard is only as reliable as the process behind it. If teams don’t agree on what “done” means, the numbers won’t match. We covered this in Process Documentation: The Hidden Reason Dashboards Fail.
5. Leaders act faster with less chasing
Executives don’t need every task. They need the signals: which projects are on track, where the risks are and where to step in. A good leadership dashboard gives a cross-department view on one screen.

When a number looks off, ClickUp lets leaders drill down from a chart straight into the tasks behind it. And with Scheduled Reports, a copy of the dashboard can land in stakeholders’ inboxes on a routine schedule, so nobody has to ask for an update.
What to Track on Your First Dashboard
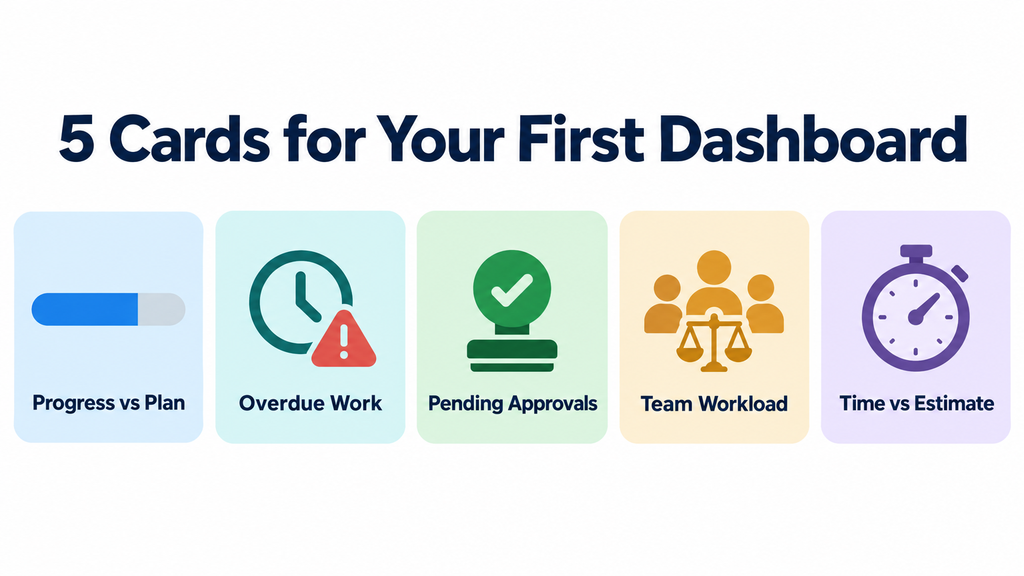
Start small. A dashboard with 25 charts gets ignored. A dashboard with five to seven cards, each answering one clear question, gets used every day.
- Progress vs plan: Are we on track for this month’s milestones?
- Overdue work: What has slipped, and who owns it?
- Pending approvals: What’s waiting on a decision?
- Team workload: Who is overloaded, and who has capacity?
- Time vs estimate: Are projects taking longer than planned? (Especially useful for client and billable work.)
Once the team trusts these, add more, such as budget tracking, client SLAs or sprint velocity.
Why Some Dashboards Never Get Used
A dashboard can look great on launch day and be forgotten a month later. The usual reasons:
- The work isn’t in the system. If updates still live in WhatsApp and Excel, the dashboard shows half the picture. See ClickUp Adoption: 5 Reasons Your Team Isn’t Using It.
- Tools aren’t connected. Deals in the CRM and tasks in ClickUp tell two different stories. The right ClickUp integrations bring them together.
- Too many charts. When everything is highlighted, nothing stands out.
- No clear owner. Someone needs to keep the cards relevant as the business changes.
- Unclear definitions. If “complete” means different things to different teams, the numbers won’t add up.
A dashboard doesn’t create clarity on its own. Clean processes and consistent data do. The dashboard just makes that clarity visible.
How Dtech Builds Dashboards Leaders Trust
At Dtech, we start with the decisions, not the charts. Before building anything, we ask: what does this person need to decide every week, and what information do they need to decide it?
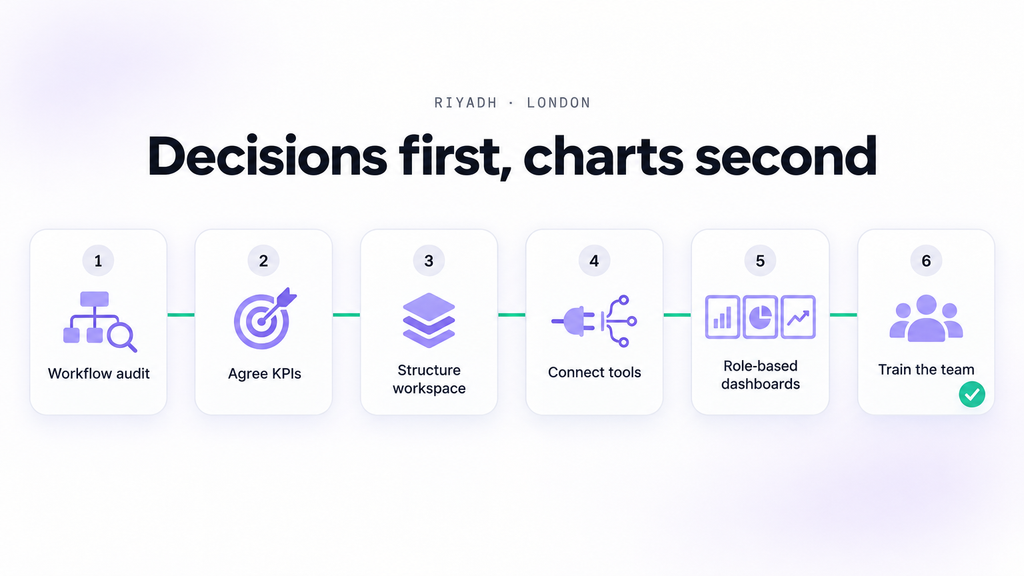
Our approach usually looks like this:
- Workflow audit: map how work actually runs today and where visibility breaks down.
- Agree KPIs and definitions: settle what each number means, so every team reads it the same way.
- Structure the workspace: set up statuses, Custom Fields and Lists so the data is clean from the start.
- Connect your tools: link CRM, ERP, email and other systems so the dashboard sees the full picture.
- Build role-based dashboards: separate views for team leads, department heads and executives.
- Train the team: hands-on adoption sessions so people keep the data current.
As a ClickUp Diamond Partner with teams in Riyadh and London, we’ve optimized 80+ workspaces across 25+ industries, in English and Arabic. If your teams already track work in ClickUp but leadership still asks for manual reports, that’s usually a structure problem, not a tool problem. Here’s why tools alone don’t fix operations.
Start With One Dashboard
You don’t need a full transformation to see results. Pick one team, one set of decisions and five cards. Get that dashboard trusted and used, then expand.
Want a second pair of eyes? Book a free workspace audit and bring one real workflow. We’ll show you what’s worth tracking and how to build a dashboard your team will actually open.
Frequently Asked Questions
Are ClickUp dashboards real-time?
ClickUp dashboards pull live data from your tasks and refresh automatically. You can also refresh the whole dashboard or a single card at any time for the latest numbers.
Who should use real-time dashboards?
Anyone who makes regular decisions about work: team leads balancing workload, project managers tracking deadlines and executives watching performance across departments.
How many cards should a dashboard have?
Start with five to seven. Each card should answer one clear question. Add more only when the team is using the first set regularly.
Can dashboards include data from other tools?
Yes. With integrations, data from CRMs, email and other systems can flow into ClickUp, so the dashboard reflects the full picture rather than just one team’s work.


